Heart Disease is the prime cause of deaths all over the world. Many problems related to heart are caused from a condition called Atherosclerosis in which a substance known as plaque gets deposited onto the surface of the blood vessels thereby narrowing the entry of blood into the arteries and making the heart work harder to pump the blood. This can cause a heart attack or a stroke.
A heart attack occurs when the blood flow to a part of the heart is blocked by a blood clot. An ischemic stroke (the most common type of stroke) occurs when a blood vessel that feeds the brain gets blocked, usually from a blood clot. A hemorrhagic stroke occurs when a blood vessel within the brain bursts. This is most often caused by uncontrolled hypertension (high blood pressure).
Heart disease encompasses a wide range of cardiovascular problems. Several diseases and conditions fall under the umbrella of heart disease. Types of heart disease include:
- Arrhythmia. An arrhythmia is a heart rhythm abnormality.
- Atherosclerosis. Atherosclerosis is a hardening of the arteries.
- Cardiomyopathy. This condition causes the heart’s muscles to harden or grow weak.
- Congenital heart defects. Congenital heart defects are heart irregularities that are present at birth.
- Coronary artery disease (CAD). CAD is caused by the buildup of plaque in the heart’s arteries. It’s sometimes called ischemic heart disease.
- Heart infections. Heart infections may be caused by bacteria, viruses, or parasites.
Heart Disease can be caused by the following:
- High blood pressure
- High cholesterol and low levels of high-density lipoprotein (HDL), the “good” cholesterol
- Smoking
- Obesity
- Physical inactivity
Healthy lifestyle choices can help you prevent heart disease. They can also help you treat the condition and prevent it from getting worse. Your diet is one of the first areas you may seek to change.
A low-sodium, low-fat diet that’s rich in fruits and vegetables may help you lower your risk for heart disease complications. One example is the Dietary Approaches to Stop Hypertension (DASH) diet.
Likewise, getting regular exercise and quitting tobacco can help treat heart disease. Also look to reduce your alcohol consumption.
In this project we will perform data analysis on the Heart Disease dataset released by the University of California, Irvine to gather meaning insights and then, from the given data we try to predict what parameters lead to a person being diagnosed with a heart disease.
We will use standard EDA techniques for data analysis and various Machine Learning models viz. Logistic Regression, Decision Trees, Random Forests, Support Vector Machines, Extreme Gradient Boosting, KNN and Naive Bayes for initial prediction and we obtain the best model by ensembling three models viz. Extreme Gradient Boosing, KNN and SVMs to achieve the best results.
At the end we will perform evaluation of the models with standard metrics.
import pandas as pd
import numpy as np

#VISUALIZATION
import matplotlib.pyplot as plt
%matplotlib inline
import seaborn as sns

from collections import Counter
import pandas_profiling as pp

from sklearn.model_selection import train_test_split

from sklearn.preprocessing import StandardScaler


from sklearn.metrics import confusion_matrix, accuracy_score
from sklearn.metrics import roc_curve, classification_report

from sklearn.linear_model import LogisticRegression
from sklearn.naive_bayes import GaussianNB
from xgboost import XGBClassifier
from sklearn.ensemble import RandomForestClassifier
from sklearn.tree import DecisionTreeClassifier
from sklearn.neighbors import KNeighborsClassifier
from sklearn.svm import SVC

from mlxtend.classifier import StackingCVClassifier
data = pd.read_csv('../input/heart-disease-uci/heart.csv')
data.head()
| age | sex | cp | trestbps | chol | fbs | restecg | thalach | exang | oldpeak | slope | ca | thal | target | |
|---|---|---|---|---|---|---|---|---|---|---|---|---|---|---|
| 0 | 63 | 1 | 3 | 145 | 233 | 1 | 0 | 150 | 0 | 2.3 | 0 | 0 | 1 | 1 |
| 1 | 37 | 1 | 2 | 130 | 250 | 0 | 1 | 187 | 0 | 3.5 | 0 | 0 | 2 | 1 |
| 2 | 41 | 0 | 1 | 130 | 204 | 0 | 0 | 172 | 0 | 1.4 | 2 | 0 | 2 | 1 |
| 3 | 56 | 1 | 1 | 120 | 236 | 0 | 1 | 178 | 0 | 0.8 | 2 | 0 | 2 | 1 |
| 4 | 57 | 0 | 0 | 120 | 354 | 0 | 1 | 163 | 1 | 0.6 | 2 | 0 | 2 | 1 |
data.info()
<class 'pandas.core.frame.DataFrame'>
RangeIndex: 303 entries, 0 to 302
Data columns (total 14 columns):
 #   Column    Non-Null Count  Dtype
---  ------    --------------  -----
 0   age       303 non-null    int64
 1   sex       303 non-null    int64
 2   cp        303 non-null    int64
 3   trestbps  303 non-null    int64
 4   chol      303 non-null    int64
 5   fbs       303 non-null    int64
 6   restecg   303 non-null    int64
 7   thalach   303 non-null    int64
 8   exang     303 non-null    int64
 9   oldpeak   303 non-null    float64
 10  slope     303 non-null    int64
 11  ca        303 non-null    int64
 12  thal      303 non-null    int64
 13  target    303 non-null    int64
dtypes: float64(1), int64(13)
memory usage: 33.3 KB
data.describe()
| age | sex | cp | trestbps | chol | fbs | restecg | thalach | exang | oldpeak | slope | ca | thal | target | |
|---|---|---|---|---|---|---|---|---|---|---|---|---|---|---|
| count | 303.000000 | 303.000000 | 303.000000 | 303.000000 | 303.000000 | 303.000000 | 303.000000 | 303.000000 | 303.000000 | 303.000000 | 303.000000 | 303.000000 | 303.000000 | 303.000000 |
| mean | 54.366337 | 0.683168 | 0.966997 | 131.623762 | 246.264026 | 0.148515 | 0.528053 | 149.646865 | 0.326733 | 1.039604 | 1.399340 | 0.729373 | 2.313531 | 0.544554 |
| std | 9.082101 | 0.466011 | 1.032052 | 17.538143 | 51.830751 | 0.356198 | 0.525860 | 22.905161 | 0.469794 | 1.161075 | 0.616226 | 1.022606 | 0.612277 | 0.498835 |
| min | 29.000000 | 0.000000 | 0.000000 | 94.000000 | 126.000000 | 0.000000 | 0.000000 | 71.000000 | 0.000000 | 0.000000 | 0.000000 | 0.000000 | 0.000000 | 0.000000 |
| 25% | 47.500000 | 0.000000 | 0.000000 | 120.000000 | 211.000000 | 0.000000 | 0.000000 | 133.500000 | 0.000000 | 0.000000 | 1.000000 | 0.000000 | 2.000000 | 0.000000 |
| 50% | 55.000000 | 1.000000 | 1.000000 | 130.000000 | 240.000000 | 0.000000 | 1.000000 | 153.000000 | 0.000000 | 0.800000 | 1.000000 | 0.000000 | 2.000000 | 1.000000 |
| 75% | 61.000000 | 1.000000 | 2.000000 | 140.000000 | 274.500000 | 0.000000 | 1.000000 | 166.000000 | 1.000000 | 1.600000 | 2.000000 | 1.000000 | 3.000000 | 1.000000 |
| max | 77.000000 | 1.000000 | 3.000000 | 200.000000 | 564.000000 | 1.000000 | 2.000000 | 202.000000 | 1.000000 | 6.200000 | 2.000000 | 4.000000 | 3.000000 | 1.000000 |
data.isnull().sum()
age         0
sex         0
cp          0
trestbps    0
chol        0
fbs         0
restecg     0
thalach     0
exang       0
oldpeak     0
slope       0
ca          0
thal        0
target      0
dtype: int64
pp.ProfileReport(data)
HBox(children=(FloatProgress(value=0.0, description='variables', max=14.0, style=ProgressStyle(description_wid…


HBox(children=(FloatProgress(value=0.0, description='correlations', max=6.0, style=ProgressStyle(description_w…


HBox(children=(FloatProgress(value=0.0, description='interactions [continuous]', max=36.0, style=ProgressStyle…


HBox(children=(FloatProgress(value=0.0, description='table', max=1.0, style=ProgressStyle(description_width='i…


HBox(children=(FloatProgress(value=0.0, description='missing', max=2.0, style=ProgressStyle(description_width=…


HBox(children=(FloatProgress(value=0.0, description='warnings', max=3.0, style=ProgressStyle(description_width…


HBox(children=(FloatProgress(value=0.0, description='package', max=1.0, style=ProgressStyle(description_width=…


HBox(children=(FloatProgress(value=0.0, description='build report structure', max=1.0, style=ProgressStyle(des…
y = data['target']
x = data.drop('target', axis = 1)

xtrain, xtest, ytrain, ytest = train_test_split(x, y, test_size = 0.2, random_state = 0)
scaler = StandardScaler()
xtrain = scaler.fit_transform(xtrain)
xtest = scaler.transform(xtest)
print(ytest.unique())
Counter(ytrain)
[0 1]


Counter({1: 131, 0: 111})
model1 = 'Logistic Regression'
lr = LogisticRegression()
model = lr.fit(xtrain, ytrain)
ypred = lr.predict(xtest)
lr_cm = confusion_matrix(ytest, ypred)
lr_acc = accuracy_score(ytest, ypred)
print('Confusion Matrix')
print(lr_cm)
print('\n')
print(f'Accuracy of {model1} : {lr_acc *100} \n')
print(classification_report(ytest, ypred))
Confusion Matrix
[[21  6]
 [ 3 31]]


Accuracy of Logistic Regression : 85.24590163934425

              precision    recall  f1-score   support

           0       0.88      0.78      0.82        27
           1       0.84      0.91      0.87        34

    accuracy                           0.85        61
   macro avg       0.86      0.84      0.85        61
weighted avg       0.85      0.85      0.85        61
model2 = 'Naive Bayes'
nb = GaussianNB()
nb.fit(xtrain, ytrain)
ypred = nb.predict(xtest)
nb_cm = confusion_matrix(ytest, ypred)
nb_acc = accuracy_score(ytest, ypred)
print('Confusion Matrix')
print(nb_cm)
print('\n')
print(f'Accuracy of {model2} : {nb_acc * 100} \n')
print(classification_report(ytest, ypred))
Confusion Matrix
[[21  6]
 [ 3 31]]


Accuracy of Naive Bayes : 85.24590163934425

              precision    recall  f1-score   support

           0       0.88      0.78      0.82        27
           1       0.84      0.91      0.87        34

    accuracy                           0.85        61
   macro avg       0.86      0.84      0.85        61
weighted avg       0.85      0.85      0.85        61
model3 = 'Random Forest Classifer'
rf = RandomForestClassifier(n_estimators = 20, random_state = 2, max_depth = 5)
rf.fit(xtrain,ytrain)
ypred = rf.predict(xtest)
rf_cm = confusion_matrix(ytest, ypred)
rf_acc = accuracy_score(ytest, ypred)
print("confussion matrix")
print(rf_cm)
print("\n")
print(f"Accuracy of {model3} : {rf_acc*100}\n")
print(classification_report(ytest,ypred))
confussion matrix
[[15  2]
 [ 2 12]]


Accuracy of Random Forest Classifer : 87.09677419354838

              precision    recall  f1-score   support

           0       0.88      0.88      0.88        17
           1       0.86      0.86      0.86        14

    accuracy                           0.87        31
   macro avg       0.87      0.87      0.87        31
weighted avg       0.87      0.87      0.87        31
model4 = 'K Neighbors Classifier'
knn = KNeighborsClassifier(n_neighbors = 10)
knn.fit(xtrain, ytrain)
ypred = knn.predict(xtest)
knn_cm = confusion_matrix(ytest, ypred)
knn_acc = accuracy_score(ytest, ypred)
print('Confusion Matrix')
print(knn_cm)
print('\n')
print(f'Accuracy of {model4} : {knn_acc * 100} \n')
print(classification_report(ytest, ypred))
Confusion Matrix
[[24  3]
 [ 4 30]]


Accuracy of K Neighbors Classifier : 88.52459016393442

              precision    recall  f1-score   support

           0       0.86      0.89      0.87        27
           1       0.91      0.88      0.90        34

    accuracy                           0.89        61
   macro avg       0.88      0.89      0.88        61
weighted avg       0.89      0.89      0.89        61
model5 = 'DecisionTreeClassifier'
dt = DecisionTreeClassifier(criterion = 'entropy', random_state = 0, max_depth = 6)
dt.fit(xtrain, ytrain)
ypred = dt.predict(xtest)
dt_cm = confusion_matrix(ytest, ypred)
dt_acc = accuracy_score(ytest, ypred)
print('Confusion Matrix')
print(dt_cm)
print('\n')
print(f'Accuracy of {model5} : {dt_acc * 100} \n')
print(classification_report(ytest, ypred))
Confusion Matrix
[[23  4]
 [ 7 27]]


Accuracy of DecisionTreeClassifier : 81.9672131147541

              precision    recall  f1-score   support

           0       0.77      0.85      0.81        27
           1       0.87      0.79      0.83        34

    accuracy                           0.82        61
   macro avg       0.82      0.82      0.82        61
weighted avg       0.82      0.82      0.82        61
model6 = 'Support Vector Classifier'
svc = SVC(kernel = 'rbf', C = 2)
svc.fit(xtrain, ytrain)
ypred = svc.predict(xtest)
svc_cm = confusion_matrix(ytest, ypred)
svc_acc = accuracy_score(ytest, ypred)
print('Confusion Matrix')
print(svc_cm)
print('\n')
print(f'Accuracy of {model6} : {svc_acc * 100} \n')
print(classification_report(ytest, ypred))
Confusion Matrix
[[23  4]
 [ 3 31]]


Accuracy of Support Vector Classifier : 88.52459016393442

              precision    recall  f1-score   support

           0       0.88      0.85      0.87        27
           1       0.89      0.91      0.90        34

    accuracy                           0.89        61
   macro avg       0.89      0.88      0.88        61
weighted avg       0.89      0.89      0.88        61
model7 = 'Extreme Gradient Boosting'
xgb = XGBClassifier(learning_rate = 0.01, n_estimators = 25,
                    max_depth = 15, gamma = 0.6,
                    subsample = 0.52, colsample_bytree = 0.6,
                    seed = 27, reg_lambda = 2, booster = 'dart',
                    colsample_bylevel = 0.6, colsample_bynode = 0.5
                   )
xgb.fit(xtrain, ytrain)
ypred = xgb.predict(xtest)
xgb_cm = confusion_matrix(ytest, ypred)
xgb_acc = accuracy_score(ytest, ypred)
print('Confusion Matrix')
print(xgb_cm)
print('\n')
print(f'Accuracy of {model7} : {xgb_acc * 100} \n')
print(classification_report(ytest, ypred))
Confusion Matrix
[[24  3]
 [ 3 31]]


Accuracy of Extreme Gradient Boosting : 90.1639344262295

              precision    recall  f1-score   support

           0       0.89      0.89      0.89        27
           1       0.91      0.91      0.91        34

    accuracy                           0.90        61
   macro avg       0.90      0.90      0.90        61
weighted avg       0.90      0.90      0.90        61
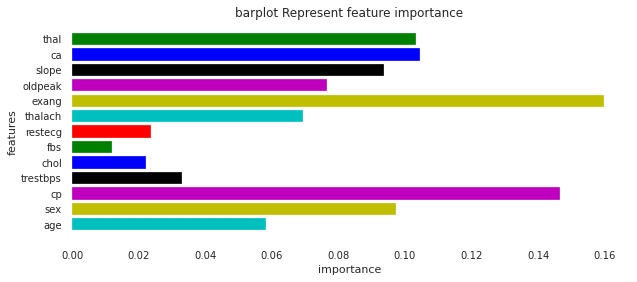
imp_features = pd.DataFrame(
    {'Feature' : ['age', 'sex', 'cp', 'trestbps', 'chol',
                  'fbs', 'restecg', 'thalach','exang',
                  'oldpeak', 'slope', 'ca', 'thal'],
    'Importance' : xgb.feature_importances_
    }
)
plt.figure(figsize=(10,4))
plt.title("barplot Represent feature importance ")
plt.xlabel("importance ")
plt.ylabel("features")
plt.barh(imp_features['Feature'],imp_features['Importance'],color = 'cymkbgr')
plt.show()
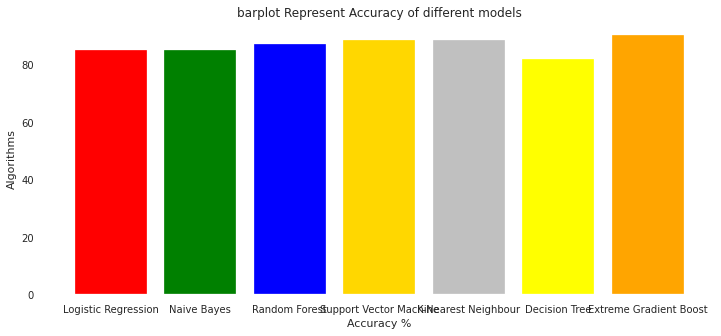
model_ev = pd.DataFrame({'Model': ['Logistic Regression','Naive Bayes',
                                   'Random Forest','Support Vector Machine',
                                   'K-Nearest Neighbour','Decision Tree',
                                   'Extreme Gradient Boost'],
                         'Accuracy': [lr_acc*100, nb_acc*100,
                                      rf_acc*100, svc_acc*100,
                                      knn_acc*100,dt_acc*100,
                                      xgb_acc*100]})
model_ev
| Model | Accuracy | |
|---|---|---|
| 0 | Logistic Regression | 85.245902 |
| 1 | Naive Bayes | 85.245902 |
| 2 | Random Forest | 87.096774 |
| 3 | Support Vector Machine | 88.524590 |
| 4 | K-Nearest Neighbour | 88.524590 |
| 5 | Decision Tree | 81.967213 |
| 6 | Extreme Gradient Boost | 90.163934 |
colors = ['red','green','blue','gold','silver','yellow','orange',]
plt.figure(figsize=(12,5))
plt.title("barplot Represent Accuracy of different models")
plt.xlabel("Accuracy %")
plt.ylabel("Algorithms")
plt.bar(model_ev['Model'],model_ev['Accuracy'],color = colors)
plt.show()
scv=StackingCVClassifier(classifiers=[xgb,knn,svc],meta_classifier= svc,random_state=42)
scv.fit(xtrain,ytrain)
ypred = scv.predict(xtest)
scv_cm = confusion_matrix(ytest, ypred)
scv_acc = accuracy_score(ytest, ypred)
print("confussion matrix")
print(scv_cm)
print("\n")
print("Accuracy of StackingCVClassifier:",scv_acc*100,'\n')
print(classification_report(ytest,ypred))
confussion matrix
[[24  3]
 [ 2 32]]


Accuracy of StackingCVClassifier: 91.80327868852459

              precision    recall  f1-score   support

           0       0.92      0.89      0.91        27
           1       0.91      0.94      0.93        34

    accuracy                           0.92        61
   macro avg       0.92      0.92      0.92        61
weighted avg       0.92      0.92      0.92        61